DORA Metrics Benchmarks 2026: Where Does Your Team Stand?
Are you Elite, High, Medium, or Low? Use these DORA benchmarks from 39,000+ teams to assess your software delivery performance and set realistic improvement targets.
Understanding DORA Performance Levels
The DORA State of DevOps research classifies software delivery teams into four performance tiers: Elite, High, Medium, and Low. These classifications are derived from empirical analysis of how teams across thousands of organizations perform on the four core DORA metrics: deployment frequency, lead time for changes, change failure rate, and mean time to recovery (MTTR).
What the tiers represent is not just speed — the research consistently shows that Elite and High performers also have better change failure rates and faster recovery times than lower-performing teams. In other words, the fastest teams are also the most stable. This counterintuitive finding — that speed and stability reinforce each other rather than trade off — is one of the most important insights from the DORA program.
Key DORA finding: Elite performers are 973 times more likely to deploy on demand and 6,570 times faster at recovering from incidents than low performers. The gap between tiers is not incremental — it is exponential.
The data source for DORA benchmarks is the annual State of DevOps Report, published by Google Cloud in partnership with the DORA research program. The most recent reports draw on survey and observational data from 39,000+ technology professionals across organizations ranging from small startups to Fortune 500 enterprises.
2026 DORA Metrics Benchmark Table
The following benchmarks reflect the current DORA performance tier definitions. Note that the boundaries between Medium and Low tiers for change failure rate and MTTR have been reexamined in recent DORA research — some older sources show slightly different numbers. Use the figures below as directional targets.
| Metric | Elite | High | Medium | Low |
|---|---|---|---|---|
| Deployment Frequency | Multiple times/day | Once/day – once/week | Once/week – once/month | < once/month |
| Lead Time for Changes | < 1 hour | 1 day – 1 week | 1 week – 1 month | 1 month – 6 months |
| Change Failure Rate | 0% – 15% | 0% – 15% | 16% – 30% | 16% – 30% |
| Mean Time to Recovery | < 1 hour | < 1 day | < 1 day | 1 day – 1 week |
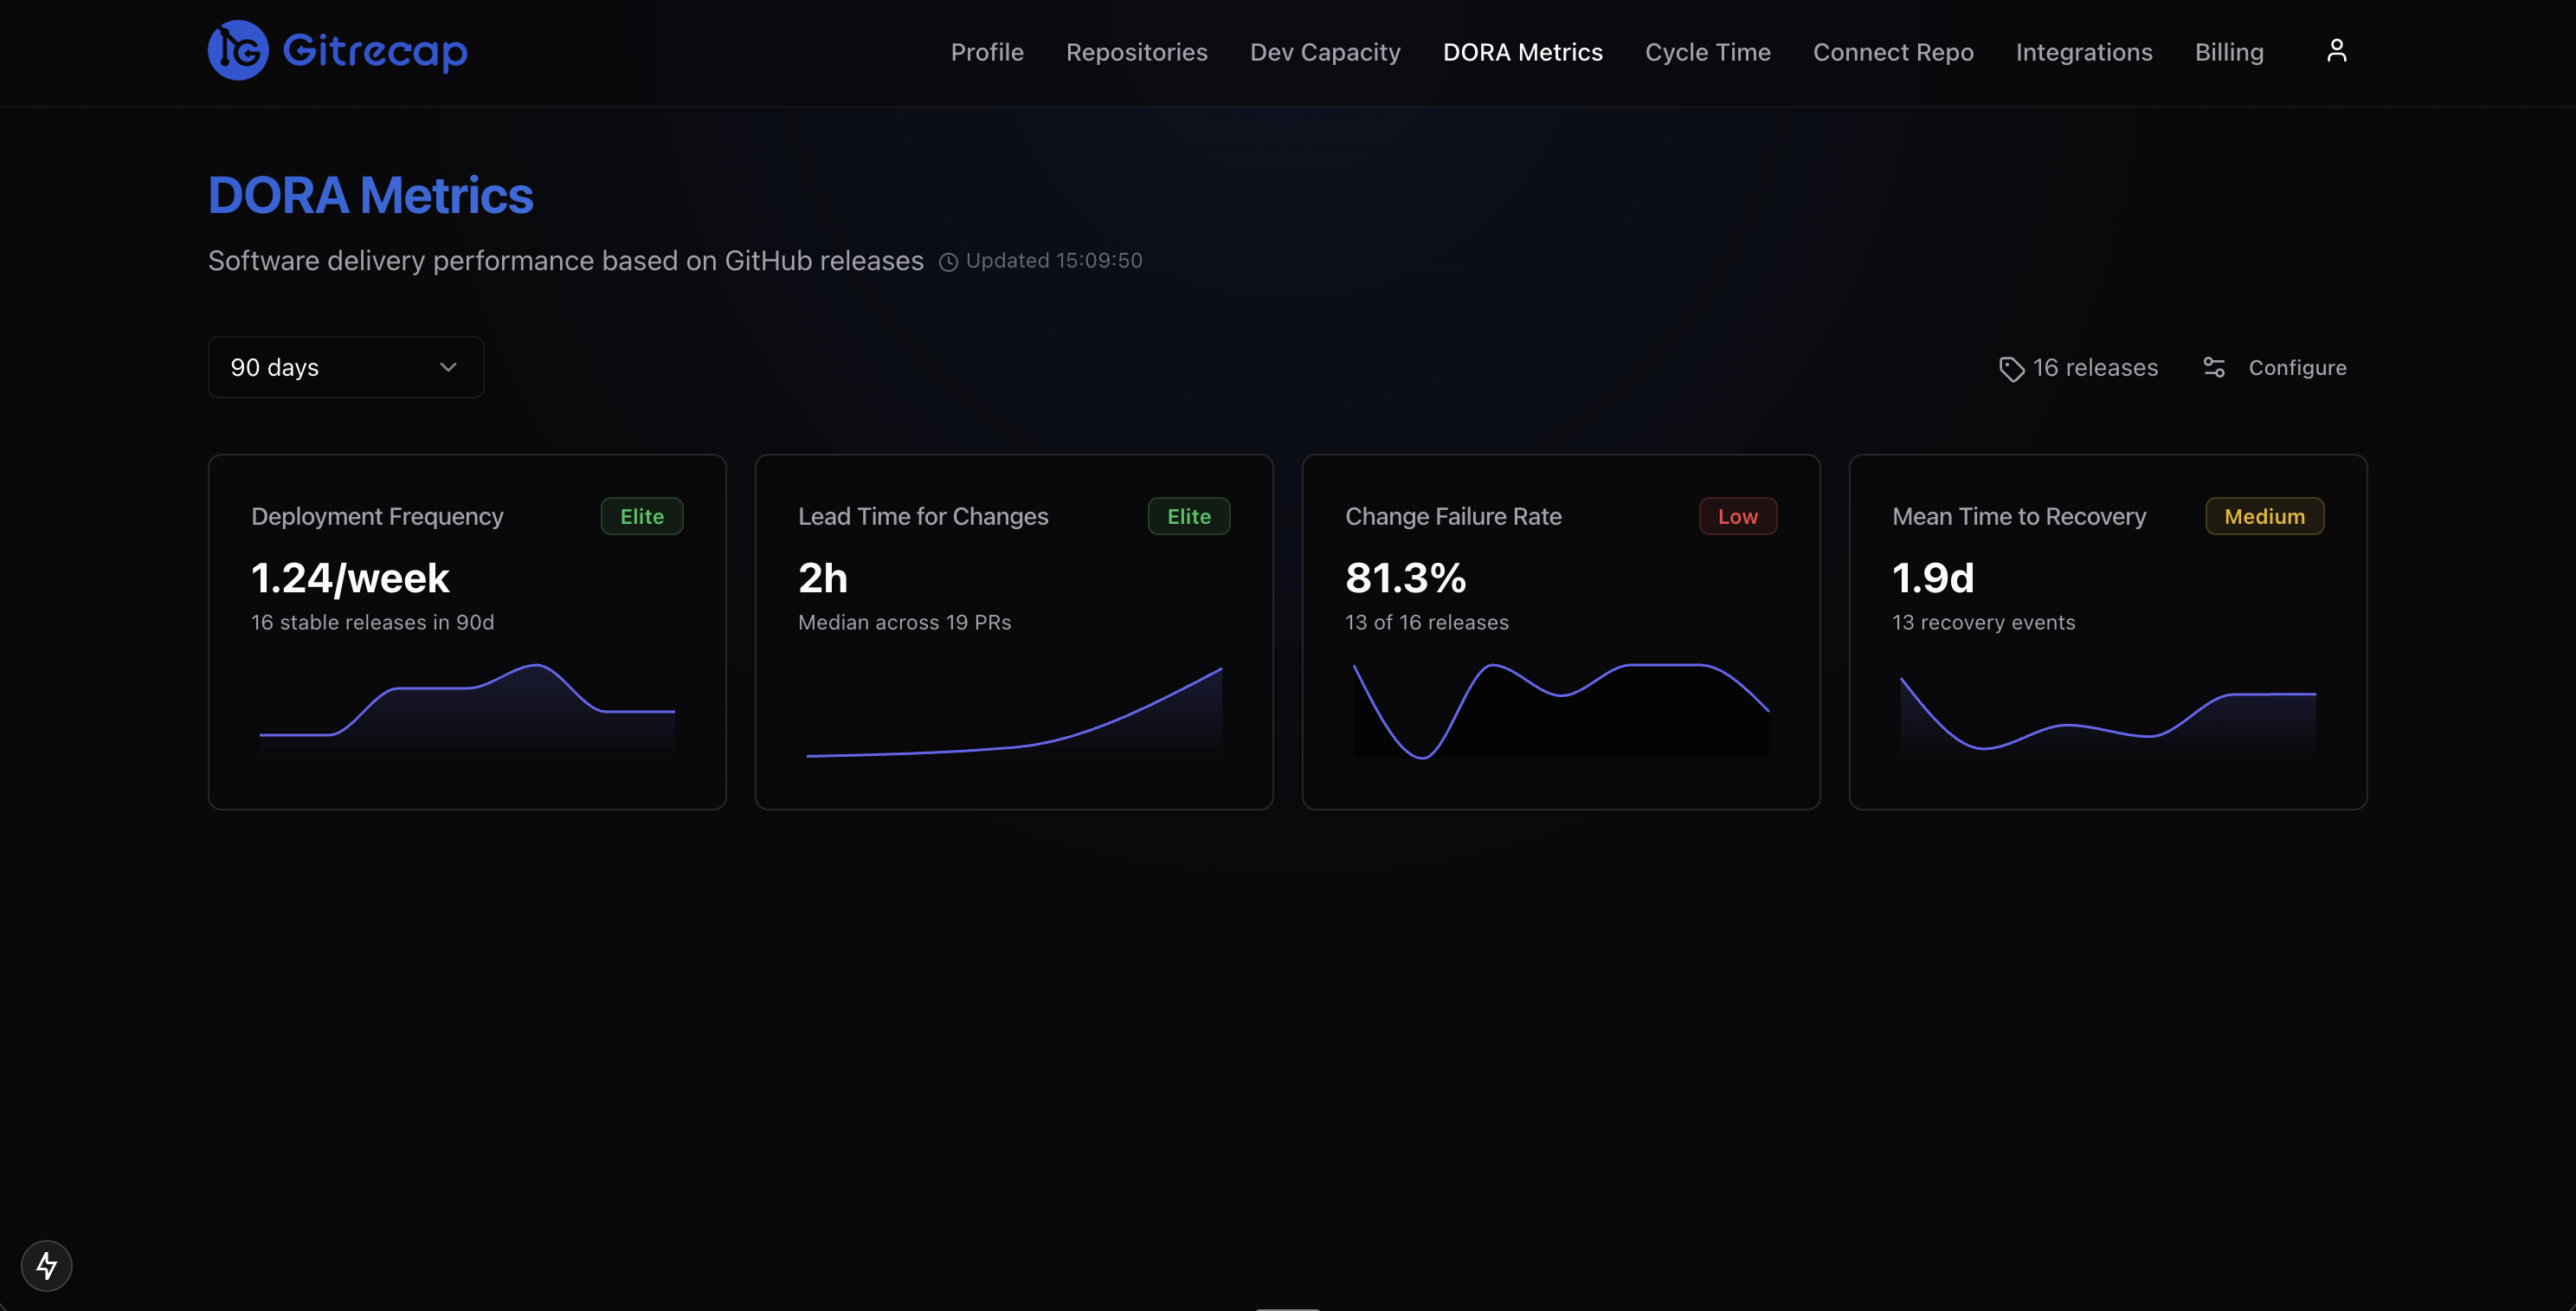
Gitrecap automatically classifies your team into the appropriate DORA tier for each metric based on your GitHub data.
Deployment Frequency Benchmarks — How Often Should You Deploy?
Deployment frequency is the most visible DORA metric and often the first one teams try to improve. It is also the metric where the gap between Elite and Low performers is most dramatic.
Elite teams at companies like Google, Netflix, and Amazon deploy to production thousands of times per day across their services. More modest Elite-tier teams — those with a single primary product — typically deploy at least once per business day. The defining characteristic of Elite deployment frequency is that deployment is a routine, automated event that does not require human coordination or scheduled windows.
High performers deploy at least once per week, often daily. Medium performers typically work in sprint cycles — deploying at the end of each sprint, usually every one to two weeks. Low performers deploy monthly or less frequently, often because releases require significant manual effort or sign-off from multiple stakeholders.
What blocks teams from deploying more frequently:
- Long-running or flaky CI/CD pipelines that make deployment slow or unreliable
- Large batch releases that require coordination across multiple teams
- Manual approval gates or change advisory board (CAB) processes
- Insufficient automated test coverage, creating fear of shipping
- Monolithic architectures where every change touches shared risk surfaces
- Lack of feature flags to separate deployment from feature release
The path from Low to Medium on deployment frequency typically involves automating the deployment pipeline and reducing manual steps. The path from Medium to Elite usually requires architectural changes — trunk-based development, feature flags, and smaller service scopes — alongside cultural shifts around deployment risk tolerance.
Lead Time for Changes Benchmarks — From Commit to Production
Lead time for changes has multiple contributing phases, and improving it requires understanding which phase dominates your current bottleneck. The typical phases are:
- Coding time: First commit to PR open
- Review wait time: PR open to first review
- Review iteration time: Time in review cycles before approval
- CI pipeline time: Test and build time before merge is possible
- Deployment pipeline time: Merge to production deployment
Elite teams have lead times under one hour because every phase is optimized: PRs are small (fast to review), CI runs are fast (parallelized, cached), and deployment is automated with no manual steps. High performers are in the one-day to one-week range — usually because review cycles take longer or deployment pipelines require some coordination.
Most teams find that review wait time is their largest lead time component. PRs sitting unreviewed for 24 or 48 hours while reviewers are in meetings or focused on their own work is the most common bottleneck. Tools that surface waiting PRs — through Slack notifications or daily digest reports — directly reduce this phase.
For a detailed breakdown of each phase and tactics to reduce it, see our guide on cycle time tracking and optimization.
Change Failure Rate Benchmarks — What is an Acceptable Failure Rate?
The change failure rate benchmark creates the most confusion among engineering teams because the distinction between Elite and High tiers uses the same range (0%–15%). What differentiates Elite from High on this metric is not the range itself but the combination with deployment frequency: Elite teams achieve that failure rate while deploying multiple times per day. High teams achieve it while deploying less frequently.
The counterintuitive reality is that 0% change failure rate is not the goal and is often a warning sign. A team reporting 0% failures either:
- Is not shipping frequently enough to encounter realistic failure conditions
- Is defining "failure" so narrowly that real incidents do not count
- Has a blameful culture where incidents are underreported
Teams with change failure rates above 30% are in Low-performer territory. This level of instability creates significant overhead: every deployment becomes a potential incident, engineers become reluctant to ship, and the remediation work from failures crowds out feature development.
The stability-speed balance: DORA research shows that high-performing teams do not trade off speed for stability — they achieve both. If your change failure rate is high, the solution is rarely to slow down deployments. It is to improve your testing, observability, and deployment practices so that you can ship quickly with confidence.
Mean Time to Recovery Benchmarks — How Fast Should You Recover?
MTTR is the DORA metric most directly tied to operational maturity. Achieving Elite-tier MTTR (under one hour) requires a specific set of capabilities that many teams take years to build:
- Observability: Alerts that fire within minutes of a production problem, not hours. This means structured logging, metrics with alerting thresholds, and distributed tracing for complex systems.
- Deployment rollback: The ability to revert a bad deployment in minutes, not hours. Blue-green deployments, canary releases, and feature flags all enable faster rollback without requiring a new deployment.
- Clear on-call processes: Defined escalation paths, runbooks for common failure modes, and on-call rotations that distribute incident response load across the team.
- Blameless incident retrospectives: A culture where engineers report incidents honestly and participate openly in retrospectives, because the goal is systemic improvement rather than individual accountability.
High performers (MTTR under one day) typically have observability and rollback capability but may lack mature on-call processes or runbooks. Medium performers often detect incidents quickly but take time to diagnose and fix because of poor observability or complex manual rollback procedures. Low performers may not know about incidents for hours before the recovery process even begins.
How to Improve Your DORA Classification
Moving up the DORA tier ladder is achievable for any team, but it requires deliberate investment in specific capabilities at each level.
From Low to Medium: Focus on consistency and automation. Establish a regular deployment cadence, even if it is only once per week. Automate your deployment pipeline to reduce manual steps. Set up basic monitoring so you know when production is degraded. Reduce PR size to speed up review cycles.
From Medium to High: Focus on eliminating friction. Move to trunk-based development or short-lived feature branches. Invest in test coverage so engineers trust the pipeline. Establish review SLAs and notification systems for waiting PRs. Create runbooks for the most common incident types.
From High to Elite: Focus on removing the last manual steps and scaling practices. Deploy on demand with feature flags separating deployment from release. Achieve CI run times under 10 minutes. Build comprehensive observability. Establish canary or blue-green deployment patterns. Run blameless retrospectives after every significant incident.
Gitrecap tracks your DORA tier over time so you can measure the impact of process improvements.
Track Your DORA Benchmarks Automatically
Manual DORA metric collection — pulling deployment records from CI logs, calculating lead times from commit timestamps, and tracking incidents in a spreadsheet — is unsustainable beyond a few weeks. The overhead of maintaining the measurement system consumes the time you should be spending on improvement.
Gitrecap's DORA metrics feature connects directly to your GitHub repositories and automatically calculates all four metrics from your existing data. Deployment frequency comes from merge events and GitHub Releases. Lead time is calculated from first commit timestamp to deployment. Change failure rate is derived from hotfix PRs and reverts. MTTR is tracked through incident-related commit patterns.
Your team is automatically classified into the appropriate DORA tier for each metric, updated continuously as new data comes in. No spreadsheets, no manual data entry, no instrumentation beyond connecting your GitHub organization.
Ready to Automate GitHub Activity Tracking?
If you'd like to automate GitHub activity tracking, try Gitrecap — no sign-up required.
Related Articles
How to Track GitHub Activity Like Jira (Without the Complexity)
Tired of complex project management tools? Discover how to track GitHub activity with Jira-like visibility using simple, automated reporting tools.
5 Free Tools to Track GitHub Team Activity Automatically
Discover the top 5 free tools that automatically track GitHub team activity, helping you monitor productivity without manual work.