PR Cycle Time Analytics for GitHub Teams
Track how long code takes from first commit to merge. Break it down into coding, pickup, review, and merge phases — then benchmark against 8.1 million pull requests to find exactly where your team is losing time.
The Gitrecap cycle time dashboard. Each row represents a pull request with coding, pickup, review, and merge times broken out individually.
What Is PR Cycle Time?
Pull request cycle time is the total elapsed time from a developer's first commit on a branch to the moment that pull request is merged into the main branch. It is the single most actionable metric for understanding how fast code moves through your engineering process.
Cycle time differs from lead time in that it measures only the engineering portion of delivery — from when a developer starts writing code to when that code is merged. You do not need a project management tool integration to measure it accurately. Every data point comes directly from your GitHub history.
The value of tracking PR cycle time is that it is objective, non-invasive, and highly actionable. Unlike story points or sprint velocity, it does not depend on estimation accuracy. When cycle time increases, something in the process changed — and the four-phase breakdown pinpoints exactly where.
The four phases of pull request cycle time
Coding Time
First commit → PR opened
The time a developer spends writing the code before opening a pull request. Long coding times often signal a PR is too large and should be split into smaller, reviewable chunks.
Measures: Work-in-progress duration before a PR is shared for review
Pickup Time
PR opened → First review
How long a PR sits idle waiting for a reviewer to engage. High pickup times indicate a review queue bottleneck and cause costly context-switching when authors have to re-load the mental model of their own code.
Measures: Time a PR waits before any reviewer engages with it
Review Time
First review → Approval
The time from when a reviewer first looks at a PR to when it receives approval. Includes back-and-forth on comments, requested changes, and subsequent reviews — the active collaboration phase.
Measures: Duration of the active code review discussion and iteration
Merge Time
Approval → Merged
The gap between a PR receiving approval and it actually being merged. Short merge times indicate a healthy deployment process; long merge times may signal merge queue contention or manual gating steps.
Measures: Delay between approval and code landing in the main branch
Phase breakdown view for a single PR. Each stage is timed independently so you can see exactly which phase inflated the total cycle time.
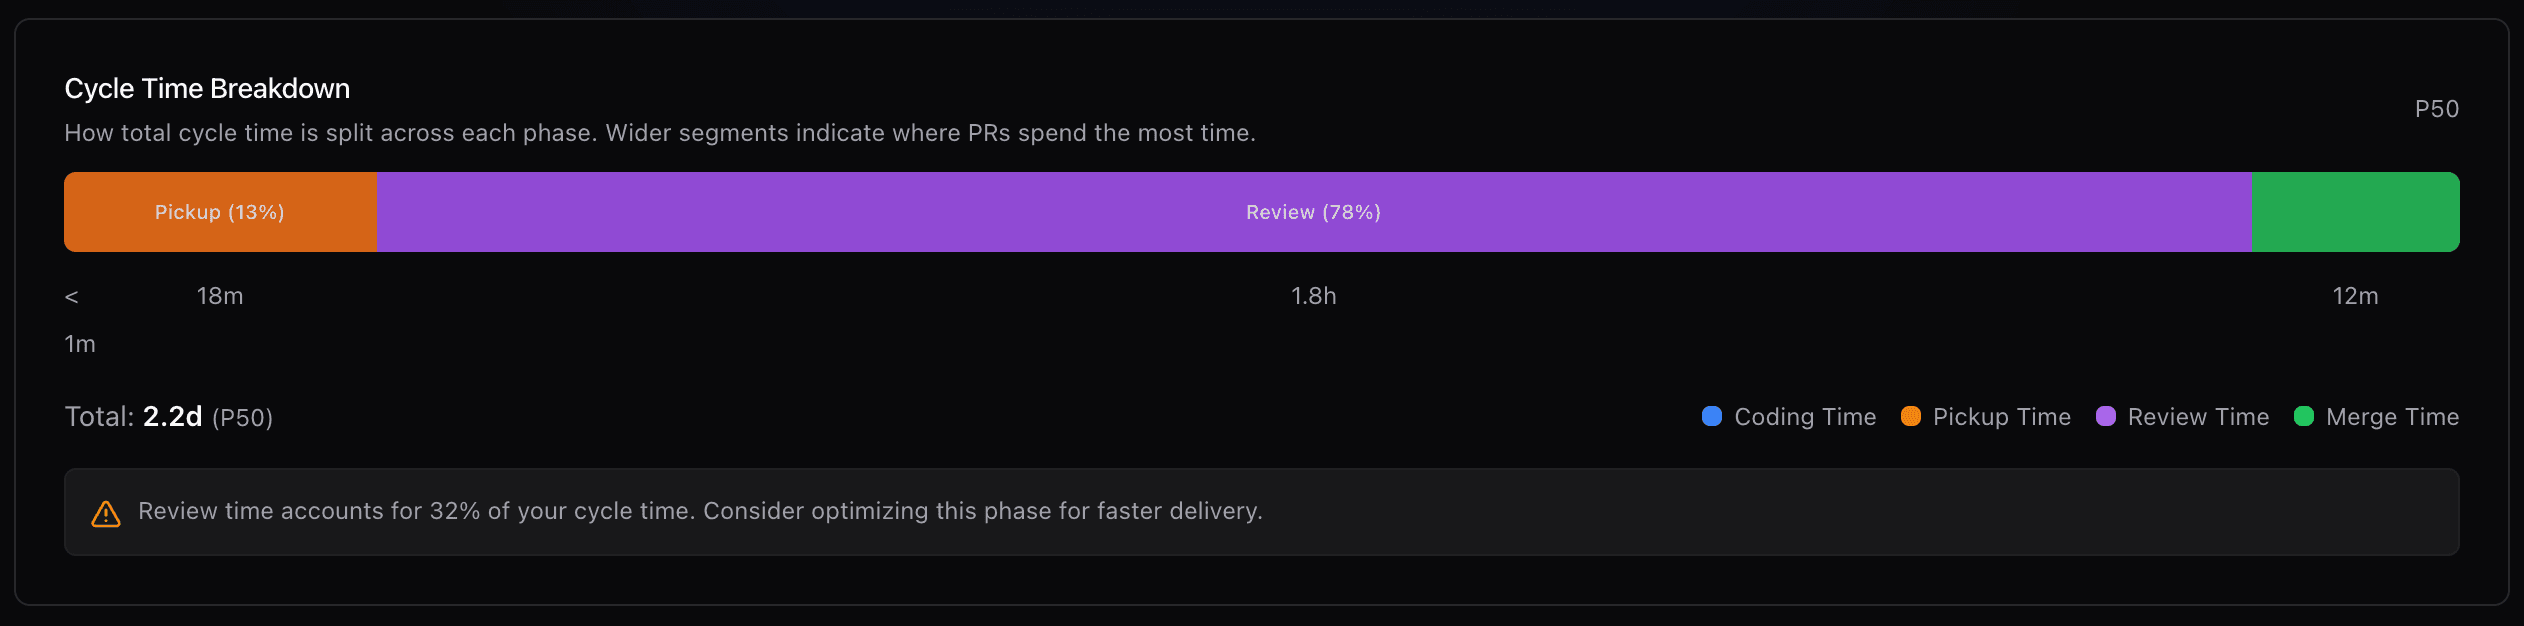
Waterfall chart showing average phase proportions across all PRs in a 30-day window. Pickup time often accounts for over 50% of total cycle time in teams without a review SLA.
PR Cycle Time Benchmarks: What Elite Teams Achieve
The following benchmarks are derived from LinearB's analysis of 8.1 million pull requests across thousands of engineering teams. They represent real-world performance thresholds, not theoretical ideals.
| Phase | Elite | High | Medium | Low |
|---|---|---|---|---|
| Coding Time | < 6 hours | 6–24 hours | 1–5 days | > 5 days |
| Pickup Time | < 1 hour | 1–5 hours | 5–24 hours | > 24 hours |
| Review Time | < 4 hours | 4–12 hours | 12–48 hours | > 48 hours |
| Merge Time | < 1 hour | 1–3 hours | 3–12 hours | > 12 hours |
| Total Cycle Time | < 12 hours | 12 hours–2 days | 2–7 days | > 7 days |
Source: LinearB Engineering Benchmarks report based on 8.1 million pull requests. Classifications represent the top 25% (Elite), 25–50% (High), 50–75% (Medium), and bottom 25% (Low) of teams by performance.
Benchmark comparison view. Your team's median for each phase is plotted against the four performance tiers so you can see at a glance where you stand relative to industry norms.
How Gitrecap Breaks Down Your PR Cycle Time
Gitrecap provides four distinct analytical views of your pull request cycle time data, each designed to answer a different question about your team's delivery process.
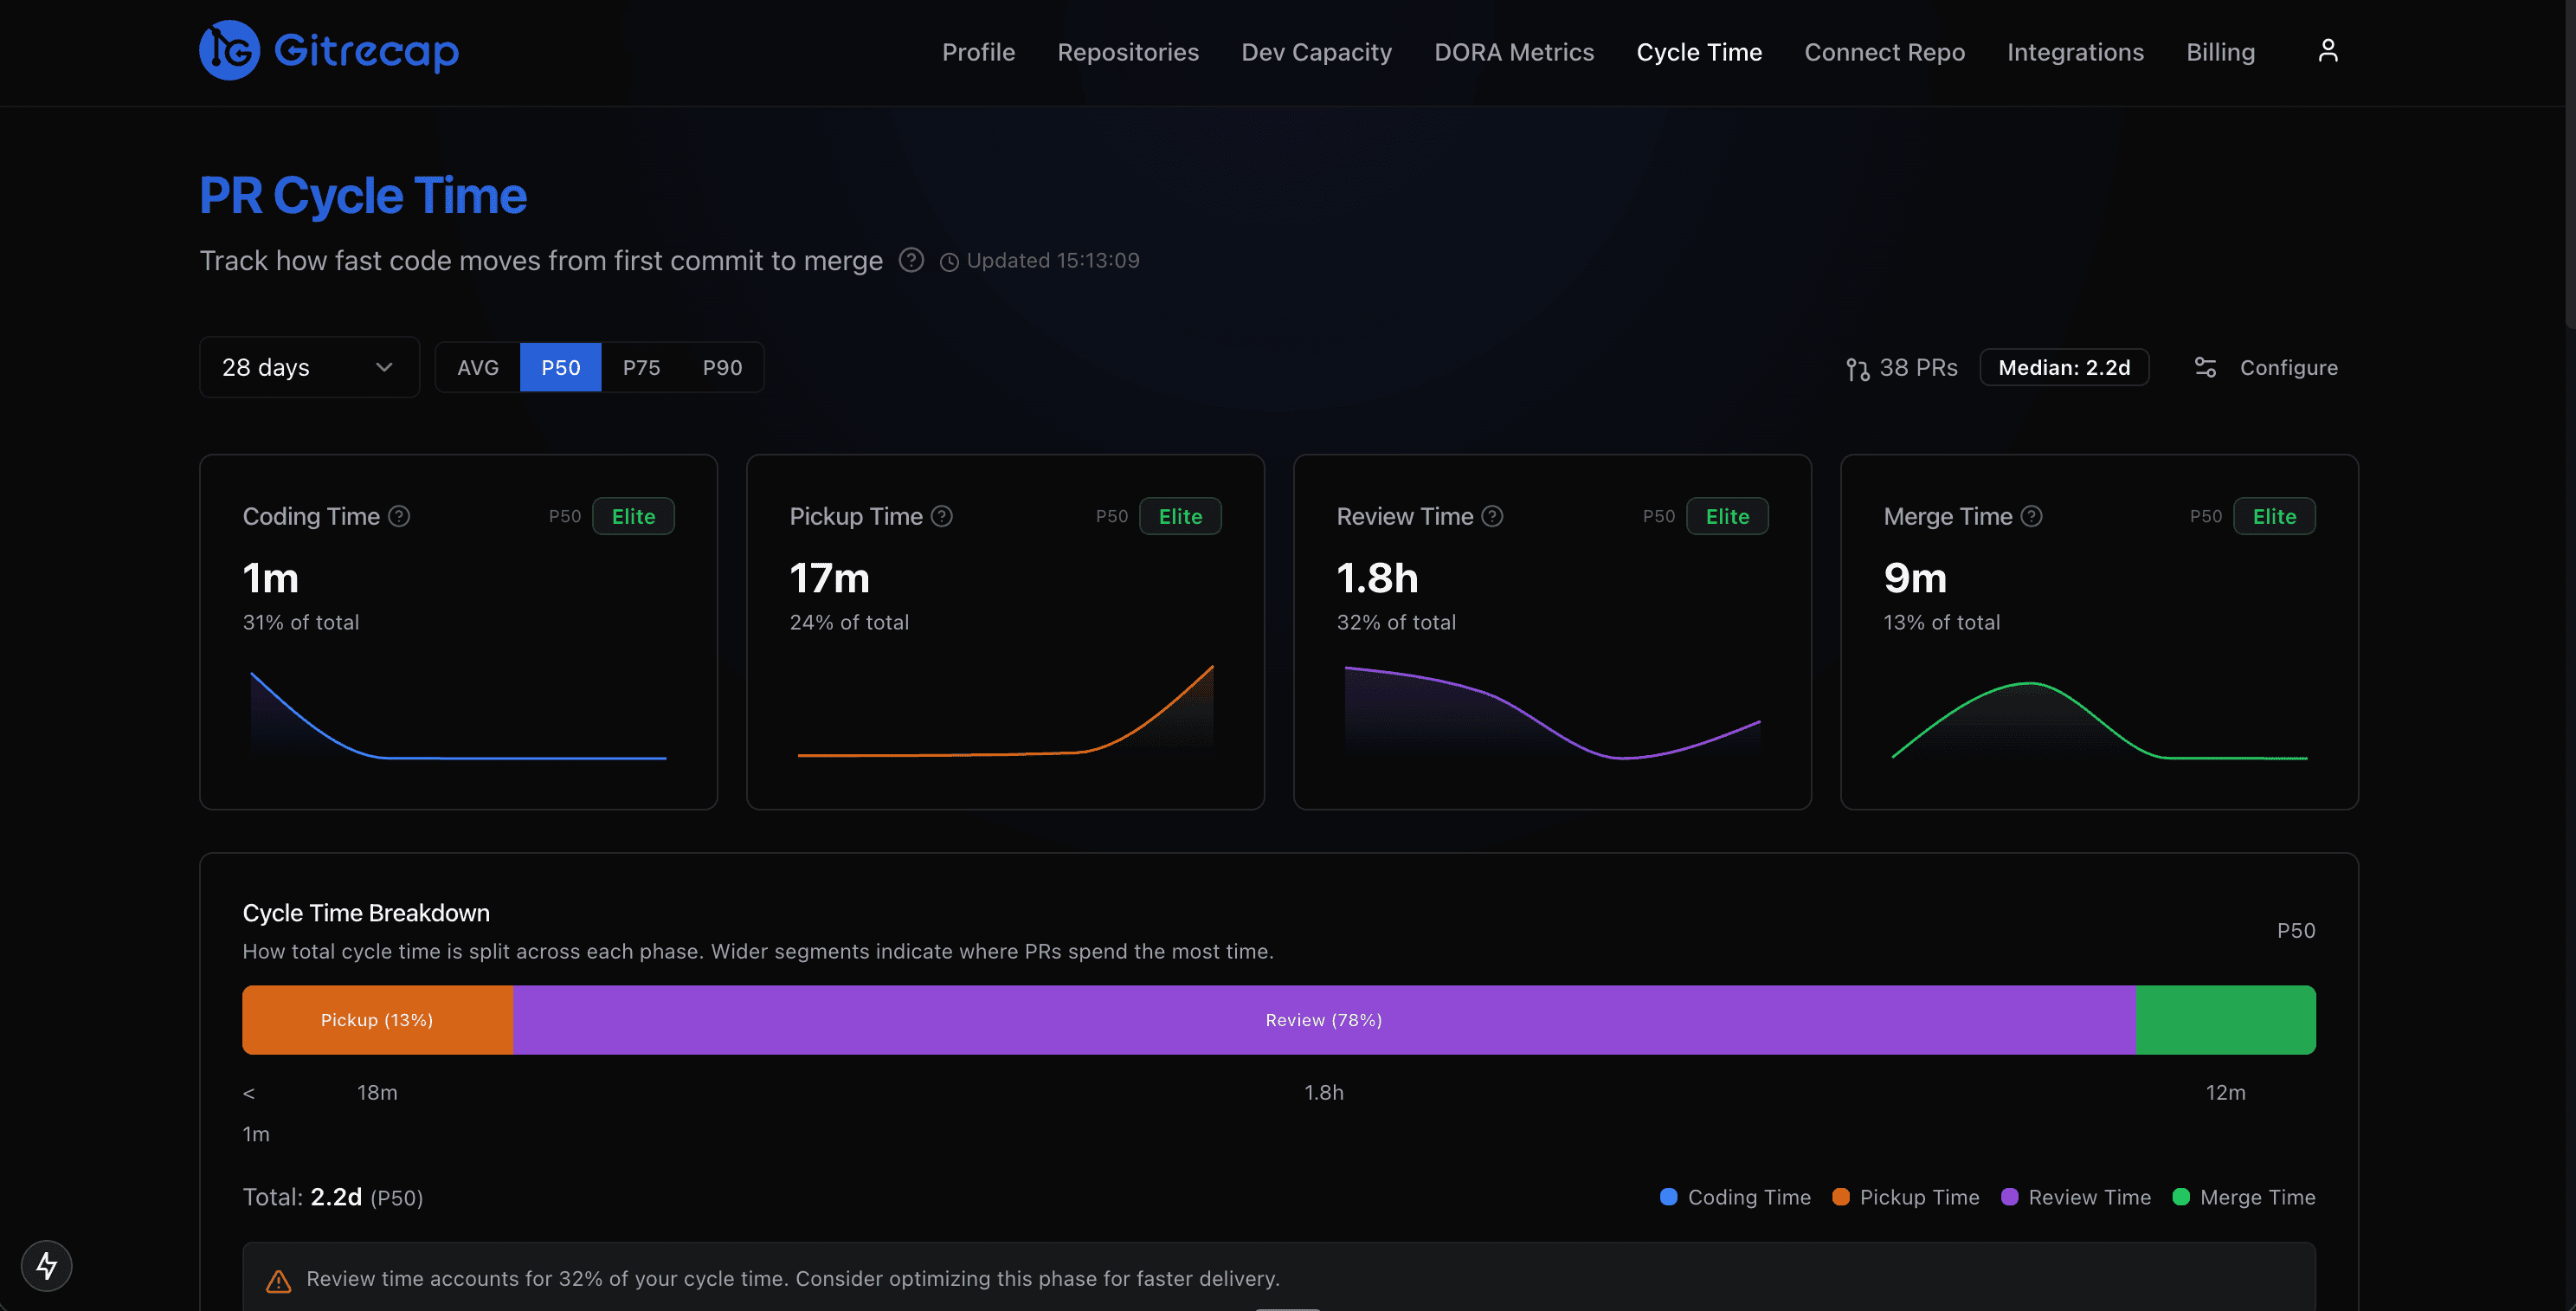
Phase Cards with Classification Badges
Each PR gets individual phase durations displayed as summary cards, color-coded against industry benchmarks. An elite badge means the phase completed faster than the top 25% of teams in LinearB's 8.1M PR dataset. A needs-attention badge flags phases where your team is losing the most time.
Phase cards for an individual PR showing each stage duration alongside benchmark classifications
Scatter Plot with Rolling Median
Individual PR cycle times plotted over time, with a rolling 30-day median overlaid. The scatter view immediately surfaces outliers — PRs that took 3× longer than normal — and shows whether your cycle time is trending up or down. Each dot links directly to the PR on GitHub.
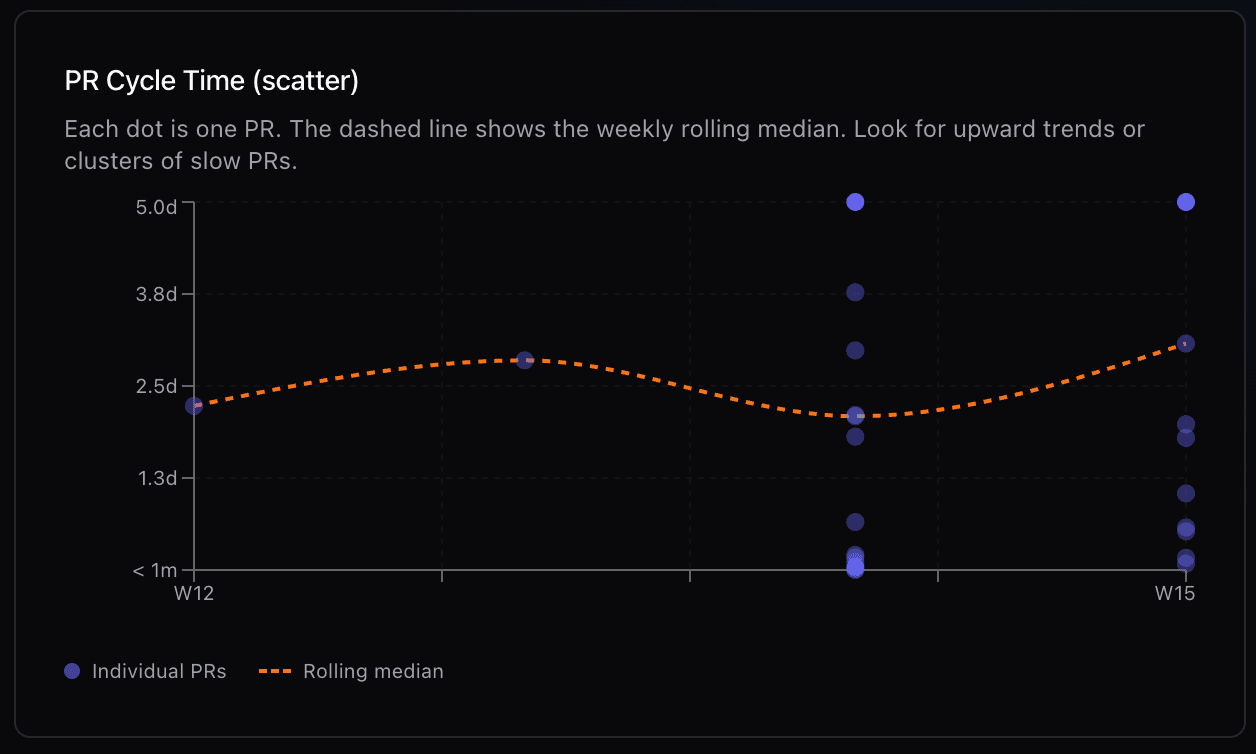
Scatter plot showing 90 days of PR cycle times with rolling median. Outlier PRs appear as dots above the trend line.
Distribution Histogram
A histogram bucketing PRs by total cycle time — under 4 hours, 4–12 hours, 12–48 hours, and so on. The distribution view reveals whether your team has a consistent cadence or a bimodal split between fast hotfixes and slow feature branches. Skew toward the right indicates a systemic bottleneck.
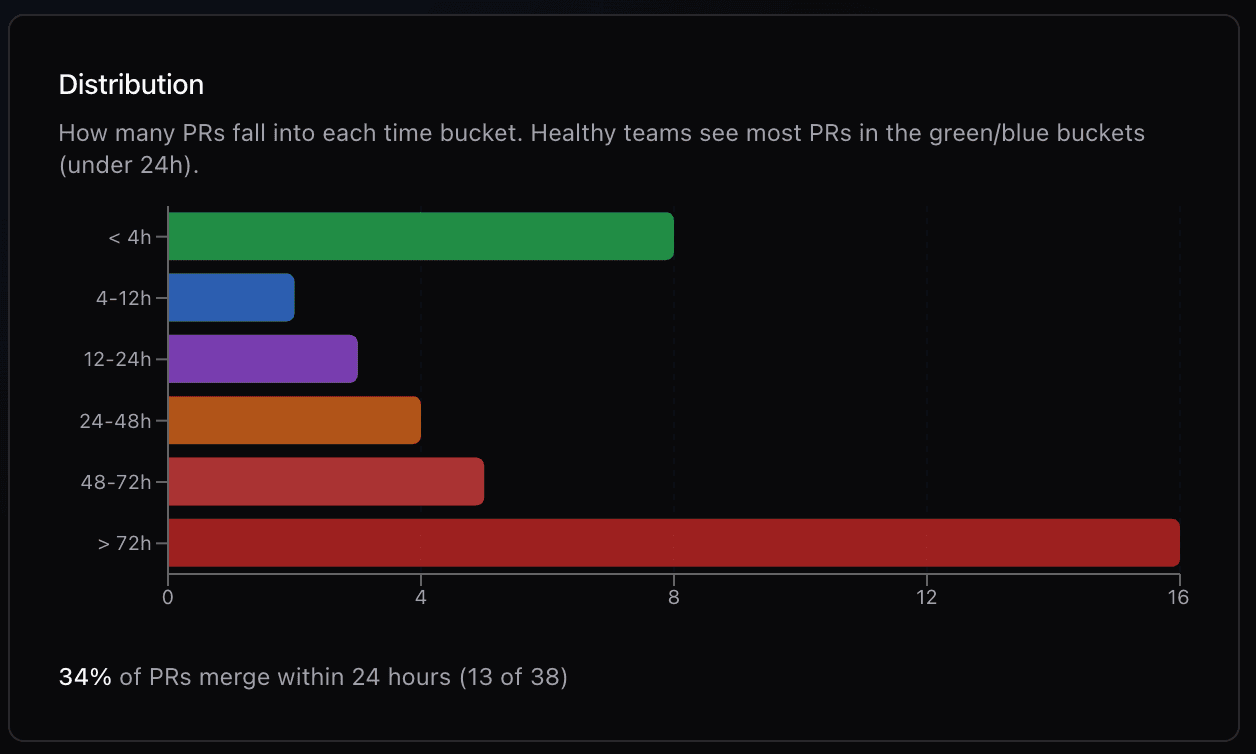
Cycle time distribution histogram. A healthy distribution is left-skewed, with most PRs completing in under 24 hours.
Bottleneck Insights
Gitrecap automatically identifies which phase is consuming the most total engineering time across all PRs in a period. It surfaces the top authors with the longest pickup times, the repos with the highest review-to-approval ratios, and PRs that have been open longest without engagement — so you know exactly where to act.
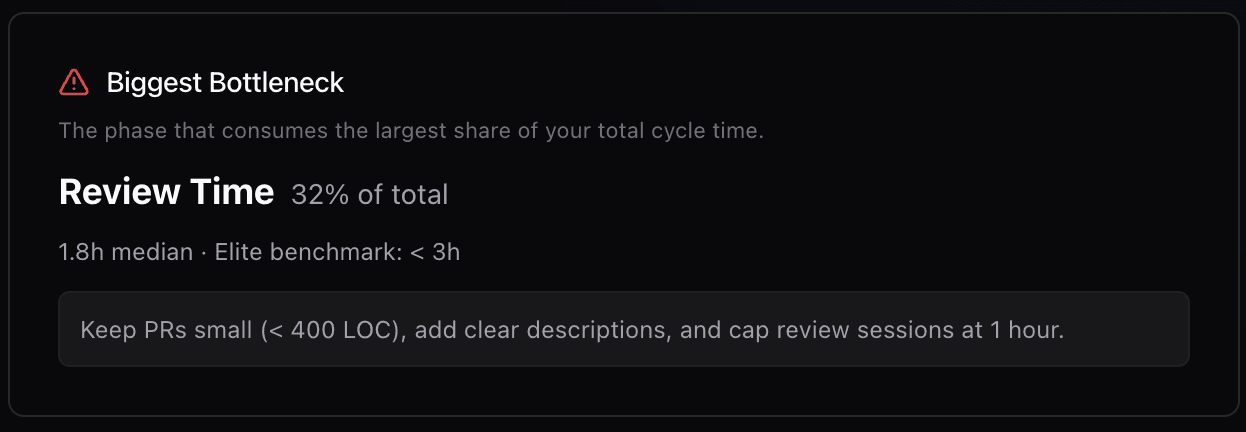
Bottleneck insights panel ranking phases by total time lost, with drill-downs by author and repository.
Why Engineering Teams Measure PR Cycle Time
Software delivery is a sequence of handoffs. Code moves from a developer's machine to a branch, from a branch to a pull request, from a PR to a reviewer, from a reviewer to a merge, and from a merge to production. Every handoff introduces waiting time. PR cycle time makes that waiting time visible.
Without measurement, engineering teams often believe their process is faster than it actually is. A PR that takes five days to merge rarely feels like five days to the author — because most of that time is invisible waiting. The author moved on to another task. The reviewer got pulled into meetings. The approver went on vacation. Cycle time surfaces the total elapsed time, not the active time, which is where the real cost lies.
The business impact compounds quickly. A team where each PR takes four days to merge can only ship approximately 65 PRs per developer per quarter. A team where PRs take one day can ship 260. The difference is not developer effort — it is process friction. Measuring and reducing PR cycle time is one of the highest-leverage improvements an engineering team can make.
How It Works
Connect Your GitHub Account
Sign up and connect your GitHub account with a single OAuth flow. Gitrecap requests read-only access to pull the commit and PR event timestamps it needs to calculate cycle time. No code is read — only metadata.
Select Repositories
Choose which repositories to include in your cycle time analysis. You can add or remove repos at any time. There is no limit on the number of repositories you can connect.
View Your Cycle Time Dashboard
Gitrecap immediately calculates cycle time for all recent PRs across your selected repositories. Phase breakdowns, scatter plots, histograms, and benchmark comparisons are populated automatically — no configuration required.
Identify Bottlenecks and Act
Use the bottleneck insights panel to see which phase is consuming the most time, which repos have the longest pickup times, and which PRs have been sitting unreviewed longest. Take the data to your next retrospective and set a measurable improvement target.
Repository configuration screen. Select the repos you want to include in your cycle time analysis and set the rolling window. Setup takes under two minutes.
Frequently Asked Questions About PR Cycle Time
What is PR cycle time?
PR cycle time (pull request cycle time) is the total elapsed time from a developer's first commit on a branch to the moment the pull request is merged into the main branch. It is one of the four DORA metrics and is widely used as a proxy for team delivery speed. A shorter cycle time means code is reaching production faster and receiving faster feedback.
How do you calculate pull request cycle time?
Pull request cycle time is calculated by summing four phases: coding time (first commit to PR open), pickup time (PR open to first review), review time (first review to approval), and merge time (approval to merged). Gitrecap calculates all four phases automatically using timestamps from the GitHub API — no manual tracking required.
What is a good PR cycle time?
Based on LinearB's analysis of 8.1 million pull requests, elite engineering teams achieve a total PR cycle time under 12 hours. High performers land between 12 hours and 2 days. Medium performers between 2 and 7 days. Teams with a cycle time over 7 days are typically experiencing significant bottlenecks in review or pickup. The most impactful lever for most teams is reducing pickup time, which is often the largest single contributor to total cycle time.
What is pickup time in code review?
Pickup time is the duration between when a pull request is opened (or marked ready for review) and when the first reviewer leaves a comment, requests changes, or approves. It measures how long code sits idle waiting for human attention. High pickup time is the most common bottleneck in pull request cycle time. It can be reduced by establishing team working agreements around review SLAs — for example, committing to reviewing any open PR within one hour during core hours.
How do I reduce PR cycle time?
The most effective strategies are: (1) keep PRs small — PRs under 200 lines of changed code are reviewed 40% faster on average; (2) set a pickup time SLA so PRs are not ignored for hours; (3) use draft PRs for early feedback to catch structural issues before a full review; (4) automate what can be automated — linting, tests, and type-checking should pass before any human reviews; (5) measure which phase is the bottleneck for your team specifically, since the fix for a pickup time problem differs from the fix for a long review time.
What is the difference between cycle time and lead time?
In software engineering, lead time typically refers to the total time from when a feature is requested or a ticket is created to when it is deployed to production. PR cycle time is a narrower, more measurable subset: the time from the first commit (when coding begins) to merge. Cycle time is fully observable from git data, whereas lead time requires integrating with a project management tool like Jira or Linear to capture the request timestamp. Gitrecap focuses on PR cycle time because it is 100% derivable from your GitHub data without additional integrations.
Why do large PRs take longer to merge?
Large pull requests are harder to review because reviewers need to hold more context in memory, the diff is harder to parse, and the risk of missing a bug is higher. Studies consistently show that PRs with more than 400 changed lines receive significantly fewer review comments per line — reviewers skim rather than scrutinize. Additionally, large PRs conflict with other branches more often, adding merge overhead. Gitrecap's cycle time data often reveals a clear correlation between PR size (measured in changed files or lines) and total cycle time, which is a compelling data point for establishing team size norms.
Can I track cycle time per developer?
Yes. Gitrecap breaks down cycle time by author, showing each developer's median coding time, the median pickup time their PRs experience, their review time, and merge time. This makes it easy to spot if one author's PRs consistently wait longer for pickup — which often points to unclear PR descriptions, ownership ambiguity, or a mismatch between the author's working hours and the reviewers' availability. Author-level data is intended for team-level process conversations, not individual performance measurement.
Start Measuring PR Cycle Time Today
Connect your GitHub repos and see your team's cycle time breakdown in under 2 minutes. No credit card required.
Start Your Free Trial7-day free trial — No credit card required