What Are DORA Metrics? The Complete Guide for Engineering Leaders (2026)
DORA metrics are the industry standard for measuring software delivery performance. This guide covers all four metrics, benchmarks from 39,000+ teams, and how to start tracking them today.
What Are DORA Metrics and Why Do They Matter?
DORA metrics are the four software delivery performance indicators defined by the DevOps Research and Assessment (DORA) program — originally founded by Dr. Nicole Forsgren, Jez Humble, and Gene Kim, and later acquired by Google. Over more than a decade of research spanning surveys of 39,000+ technology professionals across thousands of organizations, the DORA program identified the measurements that most reliably predict high-performing software teams.
What makes DORA metrics significant is not that they are intuitive — many engineering metrics are intuitive — but that they are empirically validated. The research, published annually in the State of DevOps Report, consistently shows that teams performing well on these four metrics ship more software, have higher organizational performance, and report better employee satisfaction. That combination of speed, stability, and team health is rare in any measurement framework.
Why this matters to you: Engineering leaders are constantly asked to justify headcount, tooling investments, and process changes. DORA metrics give you a vocabulary grounded in peer-reviewed research to make those arguments. When you say "our lead time for changes is 3 days and elite teams average under an hour," that lands differently than "we need to move faster."
DORA metrics became the de facto industry standard because they are outcome-oriented rather than activity-oriented. They measure what the software delivery system produces — deployed working software, stable releases, fast recovery — not how busy the team appears.
The Four Key DORA Metrics Explained
Each DORA metric captures a different dimension of software delivery performance. Together they create a balanced view of both speed and stability — the two things engineering teams are always trying to balance.
1. Deployment Frequency — How Often You Ship
Deployment frequency measures how often your team deploys code to production. It is a direct proxy for how quickly value reaches users and how well your team has mastered the mechanics of releasing software safely.
Elite teams deploy to production on demand — multiple times per day. Low-performing teams deploy somewhere between once a month and once every six months. The gap is not primarily about technical skill; it is about the systems, automation, and cultural trust in place around the deployment process.
Why it matters: High deployment frequency means smaller batches of change per release, which means lower risk per deployment, faster feedback loops, and faster delivery of value to users. Teams that deploy infrequently tend to accumulate large, risky releases that require coordination ceremonies and create anxiety.
How to improve it: Invest in CI/CD pipelines, trunk-based development, feature flags, and automated testing. The goal is to make deployment a routine, low-drama event rather than a coordinated release ceremony.
Gitrecap tracks deployment frequency automatically from your GitHub merge and release data.
2. Lead Time for Changes — How Fast You Deliver
Lead time for changes measures the elapsed time from when a developer commits code to when that code is running in production. It captures the full journey through code review, CI pipeline, staging environments, and deployment — everything that stands between writing code and it being in users' hands.
Elite teams achieve lead times under one hour. That does not mean all code ships in an hour; it means the deployment pipeline is fast enough that it could. Low-performing teams have lead times measured in months, often because of manual approvals, slow test suites, or infrequent deployment windows.
Why it matters: Lead time determines how quickly you can respond to user feedback, fix bugs, and capitalize on market opportunities. A team with a one-week lead time cannot iterate on a product the way a team with a one-hour lead time can.
How to improve it: Look at each phase separately — coding time, PR review time, CI run time, and deployment pipeline time. Usually one phase dominates. See our guide on cycle time tracking for a breakdown of each phase and how to reduce it.
3. Change Failure Rate — How Stable Your Releases Are
Change failure rate is the percentage of deployments that cause a degraded service requiring remediation — a rollback, a hotfix, or an incident response. It is the stability counterweight to deployment frequency and lead time.
Elite teams have change failure rates between 0% and 15%. Critically, 0% is not the target. A team with 0% change failure rate is likely not shipping frequently enough or is defining "failure" too narrowly. The goal is to move fast while keeping failures manageable and recoverable.
Why it matters: Every failed deployment consumes engineering time on investigation, hotfixes, and incident retrospectives. High change failure rates erode confidence in deployments and push teams toward infrequent, high-ceremony releases — the exact opposite of where you want to be.
How to improve it: Invest in automated testing, canary deployments, and feature flags that allow partial rollouts. Better code review practices and smaller PR sizes also directly reduce change failure rate.
4. Mean Time to Recovery (MTTR) — How Fast You Recover
Mean time to recovery measures how long it takes to restore service after a production incident or failed deployment. It captures your team's ability to detect problems, diagnose root cause, and ship a fix or rollback.
Elite teams recover in under one hour. This does not require never having incidents — it requires having the systems in place to detect them quickly, respond effectively, and recover without excessive manual coordination.
Why it matters: DORA research shows that MTTR is often more important than change failure rate. Systems fail. The question is whether your team has the observability, runbooks, and deployment tooling to recover quickly when they do. High-performing teams treat incidents as expected events to handle gracefully, not catastrophes to avoid at all costs.
How to improve it: Invest in observability (logs, metrics, tracing), clear on-call processes, deployment rollback capability, and blameless incident retrospectives that drive systemic improvements.
DORA Metrics Benchmarks from 39,000+ Teams
The DORA State of DevOps research classifies teams into four performance tiers: Elite, High, Medium, and Low. Here is where each metric sits across those tiers, based on the most recent DORA report data.
| Metric | Elite | High | Medium | Low |
|---|---|---|---|---|
| Deployment Frequency | Multiple times/day | Once/day to once/week | Once/week to once/month | Once/month to once/6 months |
| Lead Time for Changes | Less than 1 hour | 1 day to 1 week | 1 week to 1 month | 1 month to 6 months |
| Change Failure Rate | 0% – 15% | 0% – 15% | 16% – 30% | 16% – 30% |
| Mean Time to Recovery | Less than 1 hour | Less than 1 day | Less than 1 day | Between 1 day and 1 week |
For a deeper analysis of each tier and what it takes to move between them, see our companion article on DORA metrics benchmarks.
How to Start Measuring DORA Metrics for Your GitHub Repos
The most common barrier to tracking DORA metrics is instrumentation. Teams know they should measure these things but are not sure where the data comes from or how to wire it together. Here is the practical path:
- Define deployment events. DORA metrics require knowing when a deployment to production happened. For GitHub-based teams, this is typically a merge to your main branch, a GitHub Release, or a successful CI/CD pipeline run. Pick one definition and apply it consistently.
- Define what counts as a "failure." This is usually a rollback, a hotfix deployed within 24 hours of a release, or a P0/P1 incident opened within a deployment window. Document your definition before you start measuring.
- Collect the data. GitHub provides the raw events: pull request merges, release tags, workflow runs, and commit timestamps. Tools like Gitrecap parse this data automatically and calculate all four DORA metrics without requiring additional instrumentation.
- Review weekly. DORA metrics are most useful as trending indicators. Look at direction over 4-week windows rather than fixating on a single week's numbers.
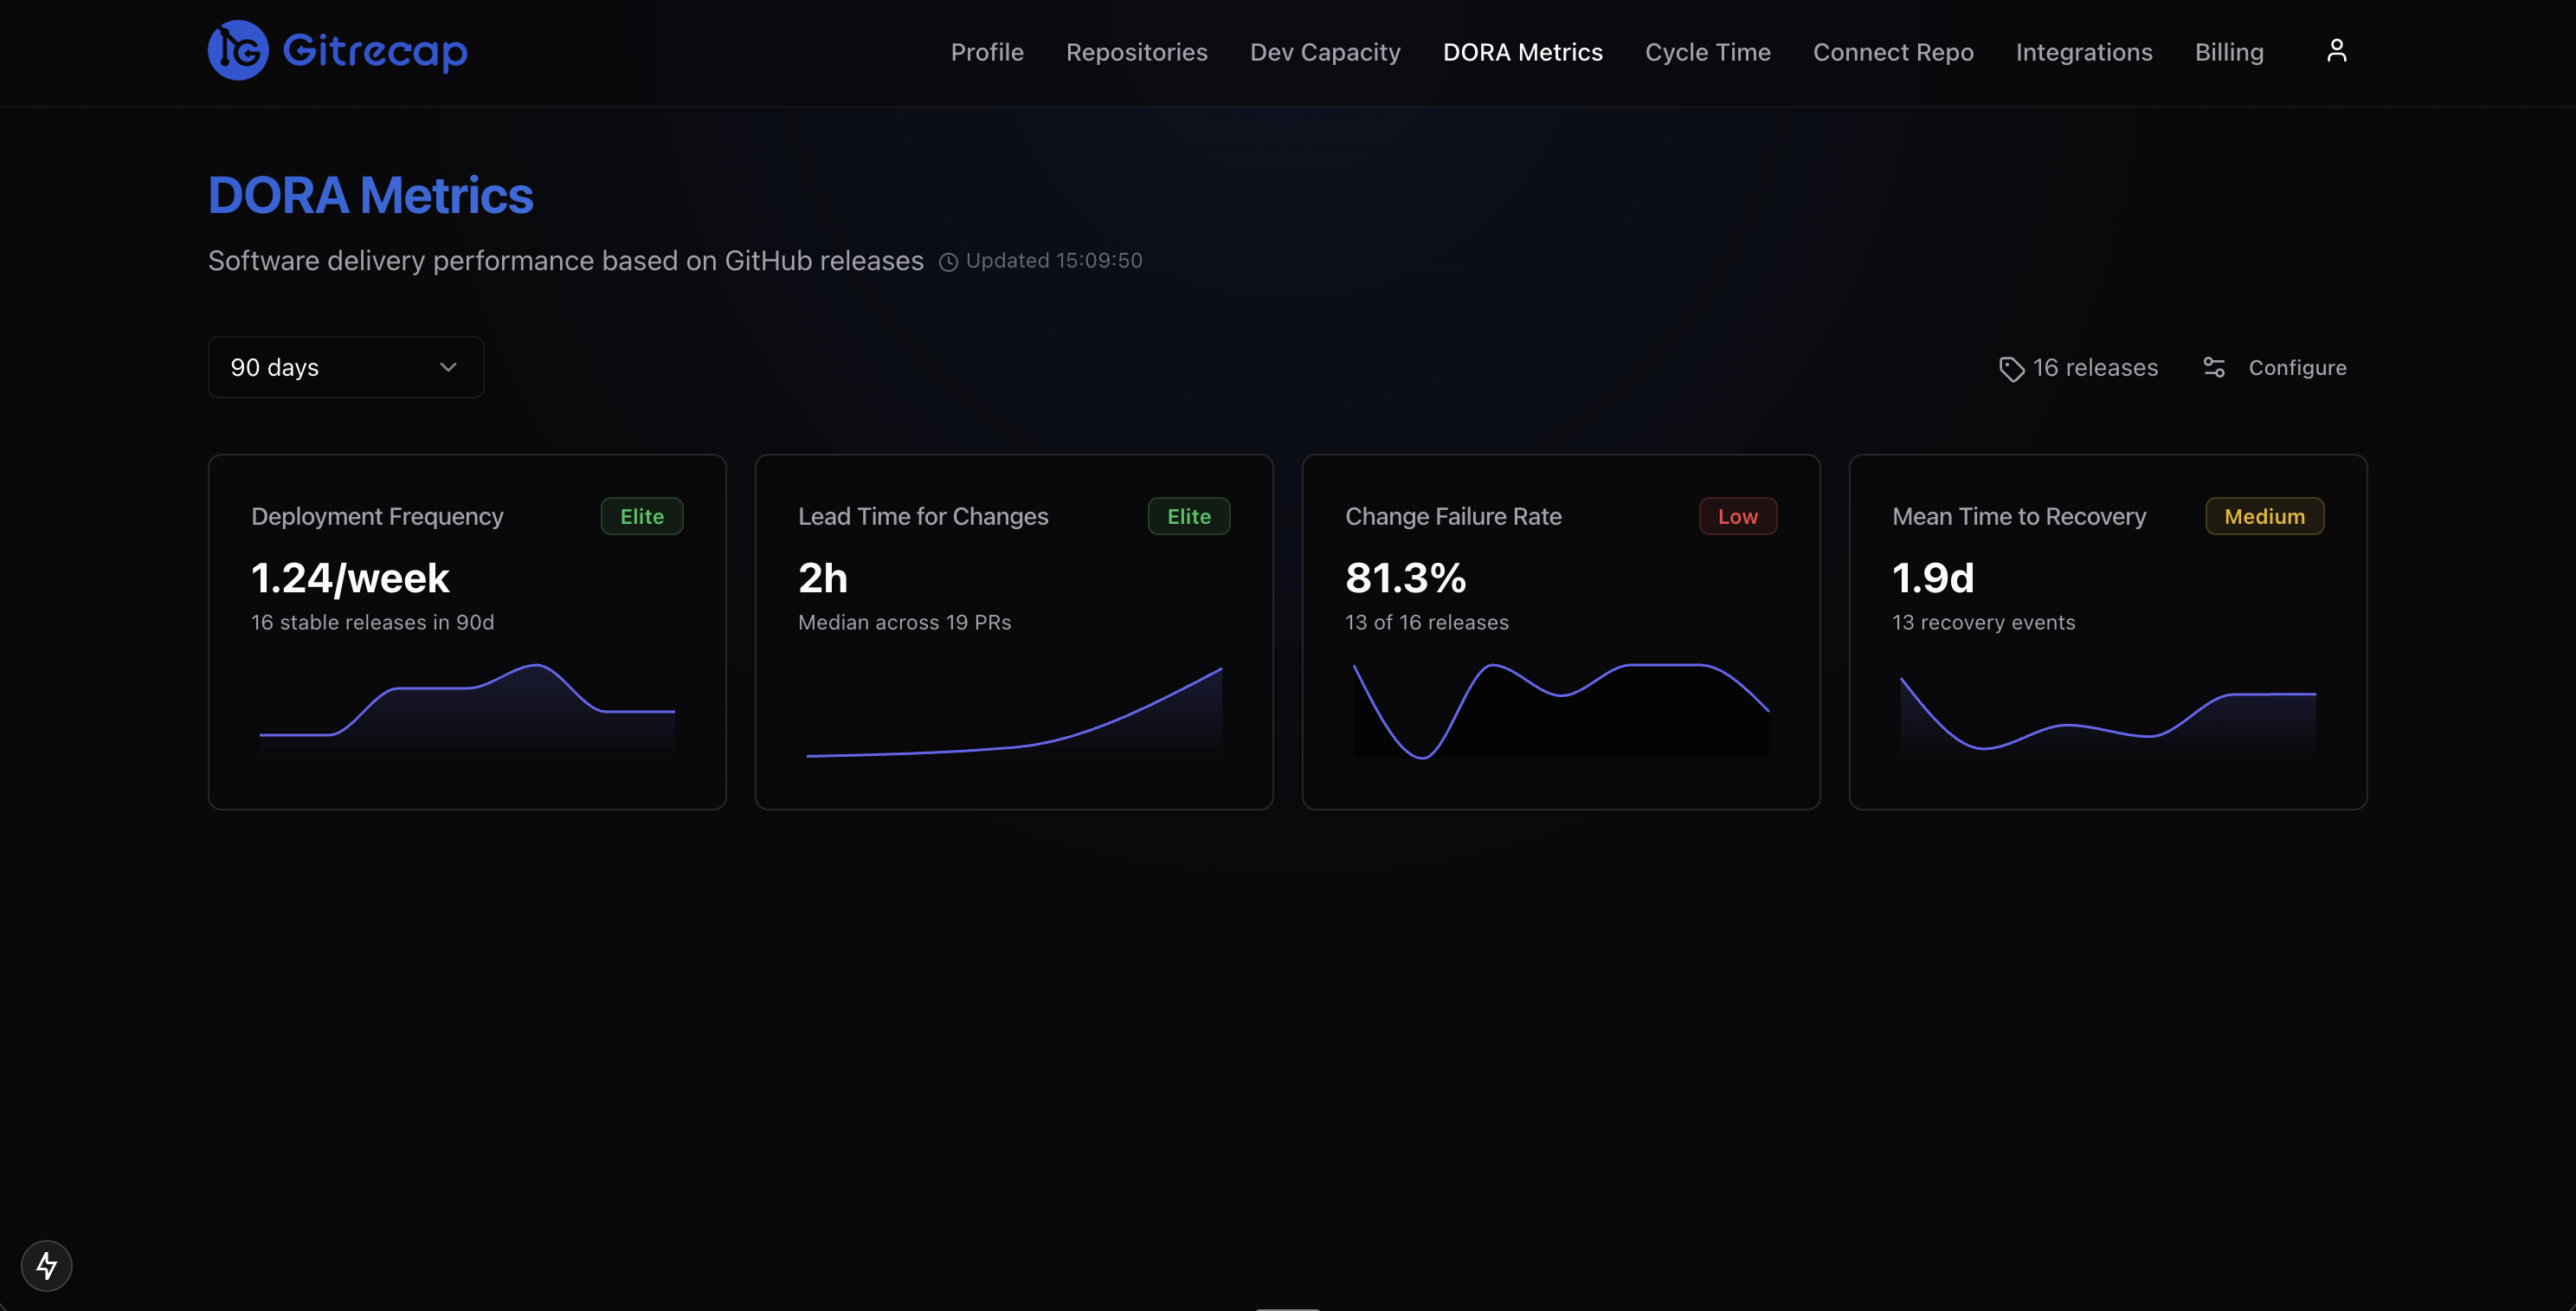
Gitrecap's DORA metrics dashboard calculates deployment frequency, lead time for changes, change failure rate, and MTTR directly from your GitHub repository data. Connect your repos and your baseline metrics are available within minutes — no additional tooling or tagging required.
Gitrecap classifies your team into Elite, High, Medium, or Low tiers for each DORA metric based on your actual GitHub data.
DORA Metrics vs SPACE Framework — What is the Difference?
The SPACE framework — Satisfaction, Performance, Activity, Communication, and Efficiency — emerged from Microsoft Research in 2021 as a complementary way to think about developer productivity. The two frameworks are frequently compared but they measure fundamentally different things.
DORA metrics measure software delivery outcomes: how often you ship, how fast you deliver, how stable your releases are, and how quickly you recover from incidents. They are entirely objective and derivable from system data.
SPACE metrics measure developer experience and productivity: how satisfied developers are, how efficiently they work, and how well collaboration flows. Many SPACE dimensions require survey data from developers themselves.
The right answer: Use both. DORA metrics tell you what your delivery system is producing. SPACE metrics help explain why. A team with poor DORA numbers might have low satisfaction scores (burned out by firefighting) or low efficiency scores (blocked by tooling or process). SPACE helps you diagnose; DORA confirms whether interventions are working.
Tools like Swarmia and LinearB have begun incorporating both frameworks. For most teams starting out, DORA metrics alone provide more than enough signal to drive meaningful improvements.
Common Mistakes When Tracking DORA Metrics
DORA metrics are straightforward to understand but easy to misuse. The following mistakes are the most common — and the most damaging.
- Using them as individual performance metrics. DORA metrics measure team and system performance, not individual developer performance. Applying them at the individual level creates perverse incentives: developers start making smaller commits to inflate deployment frequency, or rush reviews to improve lead time. The DORA researchers are explicit on this point: these are team-level indicators.
- Optimizing one metric at the expense of others. DORA metrics form a system. You can artificially inflate deployment frequency by shipping trivial changes. You can reduce change failure rate by deploying almost nothing. The four metrics need to be tracked together. If one improves dramatically while another degrades, something is wrong.
- Comparing across different team contexts. An elite classification for a team maintaining a regulated financial system looks very different from an elite classification for a consumer web startup. Regulatory constraints, system criticality, and deployment architecture all affect what is achievable. Use benchmarks as directional guidance, not absolute targets.
- Measuring once and declaring victory. DORA metrics are lagging indicators — they reflect the state of your delivery system over the past several weeks. They need to be tracked continuously to be useful. A single point-in-time measurement tells you almost nothing about trajectory.
- Ignoring the qualitative layer. DORA metrics tell you what is happening, not why. Always pair metric reviews with conversations about what constraints, blockers, or process issues the numbers are surfacing.
Ready to Automate GitHub Activity Tracking?
If you'd like to automate GitHub activity tracking, try Gitrecap — no sign-up required.
Related Articles
How to Track GitHub Activity Like Jira (Without the Complexity)
Tired of complex project management tools? Discover how to track GitHub activity with Jira-like visibility using simple, automated reporting tools.
5 Free Tools to Track GitHub Team Activity Automatically
Discover the top 5 free tools that automatically track GitHub team activity, helping you monitor productivity without manual work.